
2,340 residents claimed in July, since revised by the ONS. At 3.5% Spelthorne is still the highest of Surrey's 11 districts, with two wards at 4.9%.
Spelthorne has the highest rate of unemployment-related benefit claims of any district in Surrey. In July 2026, 2,385 borough residents were claiming, which is 3.5% of everyone aged 16 to 64.
The county average is 2.4%. No other Surrey district is above 2.8%.
The borough figure is up 120 on July last year, a rise of 5.3%. It is also down 50 from the May 2026 peak of 2,435, so the recent trend is flat rather than climbing.
The gap inside the borough is more than two to one
The claimant count is published for all 13 Spelthorne wards, and this month they sum exactly to the borough total of 2,385. The spread between them is wide:
| Ward | Claimants | Share of 16 to 64s |
|---|---|---|
| Stanwell North | 315 | 5.0% |
| Sunbury Common | 285 | 5.0% |
| Staines | 305 | 4.4% |
| Ashford Town | 225 | 4.2% |
| Staines South | 175 | 3.9% |
| Ashford North and Stanwell South | 250 | 3.7% |
| Ashford East | 150 | 3.1% |
| Halliford and Sunbury West | 105 | 2.8% |
| Ashford Common | 145 | 2.7% |
| Laleham and Shepperton Green | 140 | 2.7% |
| Sunbury East | 120 | 2.6% |
| Riverside and Laleham | 90 | 2.2% |
| Shepperton Town | 80 | 2.1% |
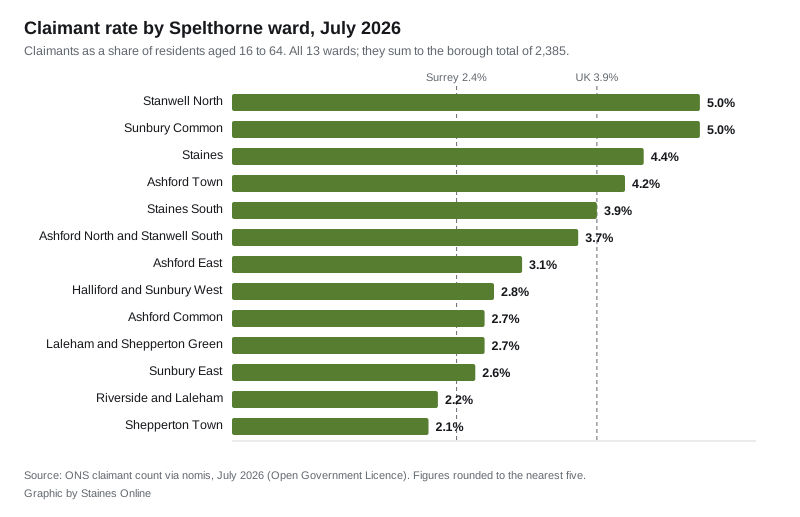
Stanwell North and Sunbury Common sit at 5.0%. Shepperton Town, at the borough’s southern edge on the Thames, is at 2.1%. Both extremes sit inside the same small borough.
Set against the whole county, six of Spelthorne’s 13 wards are among the 16 highest of Surrey’s 172 wards:
- Whyteleafe, in Tandridge, is highest at 5.5%
- Stanwell North and Sunbury Common are joint second at 5.0%, level with Canalside in Woking
- Staines is 8th at 4.4%
- Ashford Town is joint 9th at 4.2%
- Staines South is 11th at 3.9%
- Ashford North and Stanwell South is joint 13th at 3.7%
Shepperton Town, by contrast, ranks joint 90th.
What has changed since January
Ward-level figures only begin in January 2026, so there is no longer run to compare. Over those seven months the borough went from 2,265 claimants to 2,385. The ward totals add 115 over the same period, five short of the borough rise, because every published figure is rounded to the nearest five. The increase was not spread evenly:
- Staines: up 25, from 280 to 305
- Stanwell North: up 25, from 290 to 315
- Sunbury Common: up 20, from 265 to 285
- Ashford Common, Ashford North and Stanwell South, and Riverside and Laleham: up 15 each
Three wards went the other way. Laleham and Shepperton Green fell 15, Sunbury East fell 10 and Ashford Town fell 5. Shepperton Town was unchanged at 80.
The three largest increases landed in Stanwell North, Sunbury Common and Staines, which were already three of the four highest-rate wards. The pattern is not uniform, though: Ashford Town has a high rate and fell, while Riverside and Laleham has one of the lowest and rose 15.
The young-people angle does not fit here
Across much of the country the story this summer has been a sharp rise in claims among under-25s. Spelthorne is not one of those places, or at least not unusually so.
Claimants aged 16 to 24 in the borough rose from 350 in July 2025 to 410 in July 2026, an increase of 17.1%. Surrey as a whole rose 21.6% over the same period, from 2,690 to 3,270. Eight of the county’s other ten districts had steeper rises than Spelthorne, led by Surrey Heath at 39.5% and Waverley at 33.3%. Only Epsom and Ewell, where under-25 claims fell 10.8%, and Mole Valley at 3.3% were milder.
The borough’s 25 to 49 group barely moved, from 1,375 to 1,400. The over-50s went from 545 to 575.
In other words, Spelthorne’s problem is the level, not the direction, and it is spread across age groups rather than concentrated in one.
How Spelthorne compares with its neighbours
Claimant rates for July 2026, as a share of residents aged 16 to 64:
- Spelthorne 3.5%
- Woking 2.8%
- Tandridge 2.7%
- Runnymede 2.5%
- Elmbridge 2.4%
- Surrey Heath 2.3%
- Reigate and Banstead 2.2%
- Epsom and Ewell 2.1%
- Guildford 2.0%
- Mole Valley 1.9%
- Waverley 1.9%
For context, the UK figure is 3.9%. Spelthorne is above every other district in Surrey but still below the national average. Runnymede, which covers Egham, Chertsey and Addlestone, was at 2.5% with 1,510 claimants.
What it means for you
The claimant count is not the same as the unemployment rate. It counts people receiving Universal Credit or Jobseeker’s Allowance who are required to look for work. Someone in a low-paid or part-time job can be included; someone out of work but not required to seek it is not. It is a monthly indicator of local labour market pressure, not a headcount of the jobless.
The figures are rounded to the nearest five, which is why small ward changes should be read as a direction rather than an exact number.
If you are affected:
- Universal Credit claims and changes go through GOV.UK
- Spelthorne’s housing options team handles rent arrears and the risk of losing your home
- The council’s benefit calculator estimates Housing Benefit before you claim
- If you are going self-employed instead, the council lists its support for businesses
- Our Staines house prices page tracks the other half of the local cost equation
The next monthly release covering August 2026 is due in mid-September, and ward figures follow with it.
Source: ONS claimant count via nomis, July 2026, published under the Open Government Licence. Ward and district rates are claimants as a proportion of residents aged 16 to 64.
Correction, 20 September 2026: this article reported 2,385 claimants in Spelthorne in July 2026, which was the figure the ONS published at the time. In the August release, issued on 15 September 2026, July is recorded as 2,340, a cut of 45. That is an ONS revision rather than an error in our reading: the Universal Credit part of the claimant count allows revisions to the data for one previous month, and the July 2025 comparison figure of 2,265 used here is unchanged. The borough rate of 3.5 per cent is also unchanged.
Eight of the ward figures moved with it, and they still sum exactly to the revised total. Stanwell North is now 305 rather than 315, Sunbury Common 280 rather than 285, Ashford North and Stanwell South 240 rather than 250, Ashford Common 140 rather than 145, Laleham and Shepperton Green 135 rather than 140, Halliford and Sunbury West 100 rather than 105 and Sunbury East 115 rather than 120, while Ashford Town rose to 230 from 225. On the revised figures Stanwell North and Sunbury Common are both 4.9 per cent rather than 5.0, and July was 95 below the May 2026 peak rather than 50. The August 2026 figures, and the wards on the revised basis, are in our latest report.
Have your say