
Spelthorne's average rent reached £1,726 in September, up 7.1% and the fastest rise in Surrey. House prices are down 1.6% and Woking is now cheaper.
Renting in Staines-upon-Thames and the rest of Spelthorne is getting dearer faster than anywhere else in Surrey. The average private rent in the borough was £1,726 a month in September, up 7.1% on a year earlier.
Buying is going the other way. The average home sold for £440,812 in August, 1.6% less than a year before.
The figures were published on Wednesday 21 October by the Office for National Statistics and HM Land Registry. Rents run a month ahead of house prices, so the newest rent figure is for September and the newest price figure is for August.
Rents: £114 a month more than last year
A year ago the average Spelthorne rent was £1,612. It is now £1,726, which is £114 a month, or about £1,370 a year, more for the same kind of home.
Most of that rise is recent. In May, rents were only 1.1% up on the year. Then the average went from £1,637 in June to £1,726 in September, an extra £89 a month in three months, according to the ONS Price Index of Private Rents.
Spelthorne’s 7.1% is:
- the highest of Surrey’s eleven districts, ahead of Tandridge and Guildford at 5.7%
- about double the South East rise of 3.5%, where the average rent is £1,438
- well above England’s 4.0%
- 33rd of 294 English local authorities with a figure
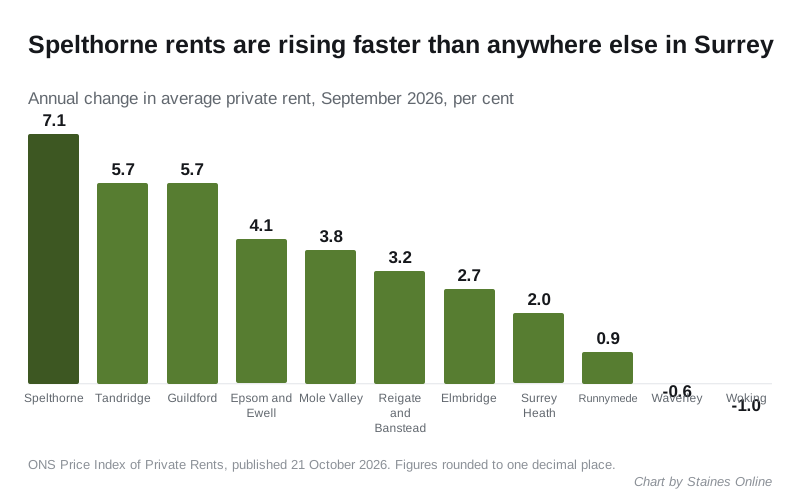
The neighbours are moving in the opposite direction. Rents in Woking fell 1.0% to £1,628, and Runnymede’s rose just 0.9% to £1,600. Spelthorne is now the third most expensive district in Surrey to rent in, behind only Elmbridge (£1,885) and Guildford (£1,754).
What renting costs by size of home
The ONS gives these averages for Spelthorne in September 2026:
| Home | Average monthly rent |
|---|---|
| One bedroom | £1,252 |
| Two bedrooms | £1,609 |
| Three bedrooms | £1,873 |
| Four or more bedrooms | £2,532 |
By type, flats and maisonettes averaged £1,493, up 6.8%. Terraced and semi-detached houses rose 7.4%, to £1,672 and £1,919.
House prices: up in August, down on the year
The average Spelthorne home was worth £440,812 in August, up 1.1% on July. That is the third monthly rise in a row, after a 0.1% rise in June and 3.1% in July.
Over the year it is still down £7,227, from £448,039 in August 2025. It is also well below the borough’s peak of £452,519 in July 2025.
The Land Registry has revised July down. We reported last month that the July average was £439,609. The August full file now puts it at £436,081, a 3.6% annual fall rather than 2.9%. Revisions like this are routine: the index is rebuilt as late sales are registered.
By type, every kind of home is down on a year ago:
| Type | Average, August 2026 | Change over the year |
|---|---|---|
| Detached | £801,004 | -1.0% |
| Semi-detached | £537,798 | -0.3% |
| Terraced | £429,803 | -0.8% |
| Flat or maisonette | £269,657 | -4.4% |
First-time buyers paid an average of £367,850, down 1.7%. Home movers paid £538,813, down 1.4%.
No longer Surrey’s cheapest place to buy
Since our June report, Spelthorne has been the cheapest of Surrey’s eleven districts. In July, Woking was only a few hundred pounds dearer.
In August the two swapped places. Woking’s average is now £437,628, which is £3,184 below Spelthorne’s. Spelthorne is now the second cheapest district in Surrey.
| Area | Average, August 2026 | Change over the year |
|---|---|---|
| Woking | £437,628 | -2.7% |
| Spelthorne | £440,812 | -1.6% |
| Surrey Heath | £457,981 | +1.5% |
| Runnymede | £472,507 | -1.2% |
| Surrey average | £524,334 | -0.2% |
| Hounslow | £528,051 | -1.5% |
| England | £293,525 | +0.4% |
Across England, 107 of 295 districts recorded a fall over the year. Spelthorne’s 1.6% fall was the 54th steepest, an improvement on 24th in July. The steepest falls are still in central London, led by the City of London at 14.6%.
What it means for you
- If you rent: the borough average has risen £89 a month since June. If your landlord proposes an increase, the ONS figures for Spelthorne by bedroom are a fair benchmark for what similar homes cost.
- If you are buying: prices are still below last year’s, and flats are down 4.4%. A first-time buyer’s average of £367,850 is £6,380 less than a year ago.
- If you are selling: three monthly rises in a row suggest the fall has slowed, but the borough is still £11,707 below its July 2025 peak.
Both measures are averages of all homes, not asking prices. The house price index is a mean, so a handful of expensive sales can lift it, and the borough sees only around 100 sales a month. The ONS calls its local rent figures “official statistics in development” and advises looking at trends over a year or longer. Local figures can move sharply from one month to the next.
More on the local market: our Staines house prices page and the July figures.
Sources
- Office for National Statistics, Housing prices in Spelthorne, updated 21 October 2026, for rents by bedroom and type, and the South East and UK rent averages.
- Office for National Statistics, Price Index of Private Rents, UK: monthly price statistics, 21 October 2026 edition, for the Surrey district and England figures, the ranking and Spelthorne’s monthly series.
- HM Land Registry, UK HPI full data file, August 2026, for Spelthorne’s averages by type and buyer, the revised July figure, the Surrey and neighbouring districts and the England ranking.
Have your say