
Spelthorne's average rent reached £1,742 in October, up 7.6% and the fastest rise in Surrey. House prices are flat on the year at £442,566.
Overview
The average private rent in Spelthorne was £1,742 a month in October 2026, up 7.6% on a year earlier. That is the fastest rise of Surrey’s eleven districts for the second month running. House prices have stopped falling but are not rising: the average home sold for £442,566 in September, 0.1% below a year before.
Both figures came out on Wednesday 18 November. The rent figure is from the ONS Price Index of Private Rents. The house price figure is from the UK House Price Index, published by HM Land Registry.
Put together, they show the borough’s two housing markets pulling apart. A year ago the average Spelthorne rent was £1,620. Tenants now pay £122 a month more, about £1,460 a year. Over the same twelve months, the price of buying a home has hardly changed.
Rents: still climbing, but more slowly
Spelthorne’s rise was 7.6% in October, up from 7.1% in September. In May it was only 1.1%.
Most of the jump came over the summer. The average rent was £1,631 in May and has risen £111 since. The month-on-month rise has eased, though:
- August: up 2.1% on July
- September: up 1.8%
- October: up 0.9%
The figures are in the ONS October 2026 rents table, edition of 18 November.
Spelthorne’s 7.6% compares with:
- 3.9% across the South East, where the average rent is £1,448
- 4.0% across England, where it is £1,472
- 2.5% in neighbouring Runnymede, where it is £1,627
Of the 64 districts in the South East, only four saw rents rise faster. Across the 334 local authorities in Great Britain covered by the index, Spelthorne ranked 25th.
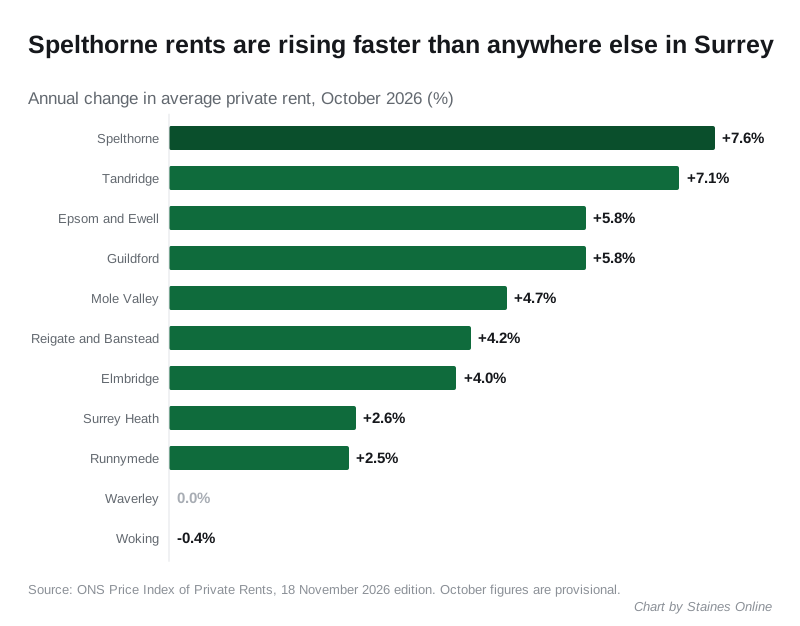
The rest of Surrey, from the same table:
| District | Average rent, October 2026 | Change on a year |
|---|---|---|
| Elmbridge | £1,909 | +4.0% |
| Guildford | £1,770 | +5.8% |
| Spelthorne | £1,742 | +7.6% |
| Epsom and Ewell | £1,741 | +5.8% |
| Reigate and Banstead | £1,672 | +4.2% |
| Tandridge | £1,669 | +7.1% |
| Woking | £1,643 | -0.4% |
| Runnymede | £1,627 | +2.5% |
| Mole Valley | £1,581 | +4.7% |
| Surrey Heath | £1,519 | +2.6% |
| Waverley | £1,479 | 0.0% |
Spelthorne is the third most expensive district in Surrey to rent in. It is £1 a month dearer than Epsom and Ewell.
What renting costs by size of home
Every size of home in the borough went up by about the same amount. Three-bedroom homes rose the most.
| Home | Average monthly rent | Change on a year |
|---|---|---|
| One bedroom | £1,262 | +7.3% |
| Two bedrooms | £1,623 | +7.2% |
| Three bedrooms | £1,892 | +7.9% |
| Four or more bedrooms | £2,556 | +7.1% |
| Flat or maisonette | £1,505 | +7.2% |
| Terraced house | £1,688 | |
| Semi-detached house | £1,938 | |
| Detached house | £2,298 |
House prices: back to where they were a year ago
The average Spelthorne home sold for £442,566 in September, according to the UK House Price Index. That is up 0.5% on August. It is £492 below September 2025, when the average was £443,058.
That 0.1% fall is the smallest since the borough’s prices first dipped below the year before, in January 2026. In June the annual fall was 6.2%.
September was the fourth monthly rise in a row. The average has climbed £20,890 since May, when it was £421,676, the lowest point of 2026. It is still £9,953 below the peak of £452,519 in July 2025.
By type of home, from the same record:
| Home | Average price, September 2026 | Change on a year |
|---|---|---|
| Detached | £805,677 | +0.6% |
| Semi-detached | £539,990 | +1.2% |
| Terraced | £430,847 | +0.4% |
| Flat or maisonette | £270,841 | -2.6% |
| First-time buyers | £368,848 | -0.3% |
| Home movers | £541,461 | +0.1% |
Houses of every kind are now worth slightly more than a year ago. Flats are the exception. Their 2.6% fall is milder than the 3.3% fall in flats across England.
Woking is still the only cheaper district in Surrey
Woking’s average was £441,783 in September, £783 below Spelthorne’s. They are the only two Surrey districts below £460,000.
| Area | Average price, September 2026 | Change on a year |
|---|---|---|
| Elmbridge | £740,883 | +3.2% |
| Surrey | £524,471 | +0.5% |
| Hounslow | £513,853 | -3.6% |
| Runnymede | £474,108 | -1.3% |
| Spelthorne | £442,566 | -0.1% |
| Woking | £441,783 | -0.4% |
| South East | £378,915 | -0.2% |
| England | £292,998 | +0.8% |
Across England, 108 of the 295 local authority districts were below their level of a year earlier, according to the Land Registry’s full data file for September. Spelthorne is one of them, by the narrowest of margins.
The summer figures have been revised down
The Land Registry revises recent months as more sales are registered. This release cut Spelthorne’s summer figures noticeably:
- May 2026: £428,821 when first reported, now £421,676
- July 2026: £439,609, now £435,563
- August 2026: £440,812, now £440,204
So the dip in the spring was deeper than it first looked, and the recovery since has been steeper. We have added notes to our July and August reports.
What it means for you
- If you rent: a typical two-bedroom home in the borough now costs £1,623 a month. If your landlord proposes a rise, the size-by-size figures above are a fair guide to what similar homes cost across Spelthorne.
- If you are buying: prices are roughly where they were a year ago, and a first-time buyer’s average is £368,848. Flats are still cheaper than last autumn.
- If you are selling: the borough average has risen for four months. A house is now worth a little more than a year ago, a flat a little less.
How to read these figures
Both are averages of what people actually pay, not asking prices. The rent index covers existing tenancies as well as new lets, so it runs below the asking rents on property websites.
The house price index is a mean, so a handful of expensive sales can lift it. The ONS calls its local rent figures “official statistics in development” and advises looking at the trend over a year or more. The latest months of both series are provisional and will be revised.
The Staines house prices page has the ward-by-ward picture from individual sales.
Sources
- Office for National Statistics, Price Index of Private Rents, UK: monthly price statistics, 18 November 2026 edition, for Spelthorne’s rents by size and type, its monthly series, the Surrey, South East and England figures and the rankings.
- HM Land Registry, UK HPI open data for Spelthorne, September 2026, and the same record for earlier months, for the averages by type and buyer and the revised May, July and August figures.
- HM Land Registry, UK HPI full data file, September 2026, for the England district count.
Have your say